Wunderground Datacollection in OpenNMS
I’ve become a fan of OpenNMS as a general purpose monitoring and datacollection platform.
It has a lot of “enterprise” features that I don’t need for most of my personal stuff, but (IMHO) it does a better job of doing basic service monitoring, performance metric collection, etc than things like Nagios (or other hacks I’ve made in the past).
One thing I’ve done with it is start to collect my local weather data, so that I can graph it side-by-side with data pulled from my thermostat, etc.
Unfortunately, the Weather Underground API is no longer free (“as in
beer”) no longer available, but hopefully this serves as an example of the sort of stuff you can do with OpenNMS.
OpenNMS is able to collect data from a number of sources, including SNMP, and basically anything you get fetch over HTTP.
To get data from Wunderground, we’ll use the XmlCollector.
Despite its name, it can also work with JSON, though in this case, Wunderground gives us XML anyways.
We need to update collectd-configuration.xml with two new parts:
   <package name="wunderground-conditions" remote="false">
      <filter>IPADDR != '0.0.0.0'</filter>
      <include-range begin="1.1.1.1" end="254.254.254.254"/>
      <include-range begin="::1" end="ffff:ffff:ffff:ffff:ffff:ffff:ffff:ffff"/>
      <service name="Wunderground-Conditions" interval="300000" user-defined="true" status="on">
         <parameter key="collection" value="wunderground_conditions_home"/>
         <parameter key="handler-class" value="org.opennms.protocols.xml.collector.DefaultXmlCollectionHandler"/>
      </service>
   </package>
   <!-- ... -->
   <collector service="Wunderground-Conditions" class-name="org.opennms.protocols.xml.collector.XmlCollector"/>
This tells OpenNMS that, if we have a node configured with the “Wunderground-Conditions” service, it should trigger this datacollection.
Next, we need to add some specific configuration for the XmlCollector, in xml-datacollection-config.xml:
    <xml-collection name="wunderground_conditions_home">
        <rrd step="300">
            <rra>RRA:AVERAGE:0.5:1:2016</rra>
            <rra>RRA:AVERAGE:0.5:12:1488</rra>
            <rra>RRA:AVERAGE:0.5:288:366</rra>
            <rra>RRA:MAX:0.5:288:366</rra>
            <rra>RRA:MIN:0.5:288:366</rra>
        </rrd>
        <xml-source url="http://api.wunderground.com/api/YOURAPIKEY/conditions/q/SOMEWHERE/Outthere.xml">
            <import-groups>xml-datacollection/wunderground.xml</import-groups>
        </xml-source>
    </xml-collection>
Here, the “name” of the collection matches up with the paramter we defined in the Collectd config.
If you’re lucky enough to still have a Wunderground API key, you just need to put it in place of YOURAPIKEY above,
and change the rest of the query to be something like /conditions/q/NY/New_York.xml.
That tells OpenNMS where to get the data from, but we still need one more file to tell it how to parse the data,
and decide what to store. We put that in xml-datacollection/wunderground.xml (the import-groups entry above):
<xml-groups>
   <xml-group name="wunderground_conditions" resource-type="node" resource-xpath="/response/current_observation">
      <xml-object name="temp_c" type="GAUGE" xpath="temp_c"/>
      <xml-object name="temp_f" type="GAUGE" xpath="temp_f"/>
      <xml-object name="UV" type="GAUGE" xpath="UV"/>
      <xml-object name="dewpoint_c" type="GAUGE" xpath="dewpoint_c"/>
      <xml-object name="dewpoint_f" type="GAUGE" xpath="dewpoint_f"/>
      <xml-object name="feelslike_c" type="GAUGE" xpath="feelslike_c"/>
      <xml-object name="feelslike_f" type="GAUGE" xpath="feelslike_f"/>
      <xml-object name="heat_index_c" type="GAUGE" xpath="heat_index_c"/>
      <xml-object name="heat_index_f" type="GAUGE" xpath="heat_index_f"/>
      <xml-object name="precip_1hr_in" type="GAUGE" xpath="precip_1hr_in"/>
      <xml-object name="precip_1hr_metric" type="GAUGE" xpath="precip_1hr_metric"/>
      <xml-object name="precip_today_in" type="GAUGE" xpath="precip_today_in"/>
      <xml-object name="precip_today_metric" type="GAUGE" xpath="precip_today_metric"/>
      <xml-object name="pressure_in" type="GAUGE" xpath="pressure_in"/>
      <xml-object name="pressure_mb" type="GAUGE" xpath="pressure_mb"/>
      <xml-object name="visibility_km" type="GAUGE" xpath="visibility_km"/>
      <xml-object name="visibility_mi" type="GAUGE" xpath="visibility_mi"/>
      <xml-object name="wind_degrees" type="GAUGE" xpath="wind_degrees"/>
      <xml-object name="wind_gust_kph" type="GAUGE" xpath="wind_gust_kph"/>
      <xml-object name="wind_gust_mph" type="GAUGE" xpath="wind_gust_mph"/>
      <xml-object name="wind_kph" type="GAUGE" xpath="wind_kph"/>
      <xml-object name="wind_mph" type="GAUGE" xpath="wind_mph"/>
      <xml-object name="windchill_c" type="GAUGE" xpath="windchill_c"/>
      <xml-object name="windchill_f" type="GAUGE" xpath="windchill_f"/>

      <xml-object name="display_location" type="String" xpath="display_location/full"/>
   </xml-group>
</xml-groups>
That should “just work” for any Wundergroud location, and should tell OpenNMS to hold on to basically all of the numeric values I saw in the results. All of that get stored in your time series database of choice (JRobin, RRDtool, or Newts).
It also holds onto the “display_location” string (just the latest value), which you can use to help give a more meaningful label to your graphs.
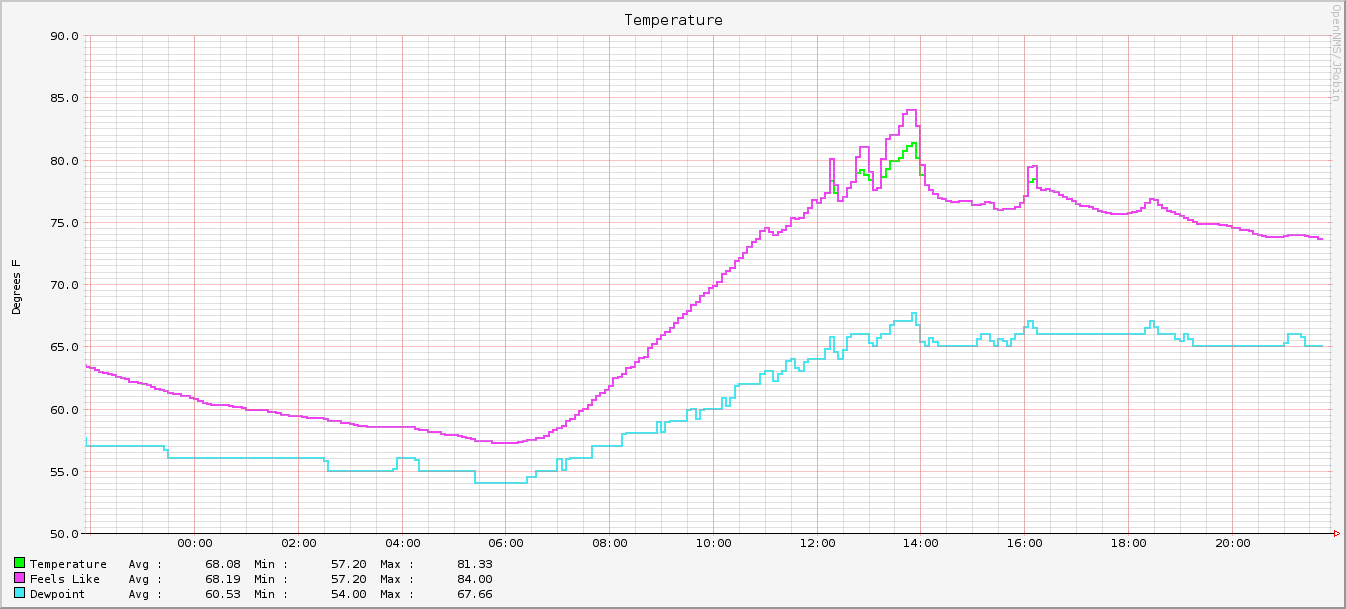
Finally, we’ll want to build a pretty graph to show that our datacollection is working:
reports=wunderground.conditions.temp

report.wunderground.conditions.temp.name=Temperature
report.wunderground.conditions.temp.columns=temp_f,feelslike_f,dewpoint_f
report.wunderground.conditions.temp.type=nodeSnmp
report.wunderground.conditions.temp.command=--title="Temperature" \
  --vertical-label="Degrees F" \
  DEF:temp_f={rrd1}:temp_f:AVERAGE \
  DEF:feelslike_f={rrd2}:feelslike_f:AVERAGE \
  DEF:dewpoint_f={rrd3}:dewpoint_f:AVERAGE \
  LINE2:temp_f#00ff00:"Temperature " \
  GPRINT:temp_f:AVERAGE:"Avg \\: %10.2lf" \
  GPRINT:temp_f:MIN:"Min \\: %10.2lf" \
  GPRINT:temp_f:MAX:"Max \\: %10.2lf\\n" \
  LINE2:feelslike_f#ee42f4:"Feels Like  " \
  GPRINT:feelslike_f:AVERAGE:"Avg \\: %10.2lf" \
  GPRINT:feelslike_f:MIN:"Min \\: %10.2lf" \
  GPRINT:feelslike_f:MAX:"Max \\: %10.2lf\\n" \
  LINE2:dewpoint_f#42e8f4:"Dewpoint    " \
  GPRINT:dewpoint_f:AVERAGE:"Avg \\: %10.2lf" \
  GPRINT:dewpoint_f:MIN:"Min \\: %10.2lf" \
  GPRINT:dewpoint_f:MAX:"Max \\: %10.2lf\\n"
That gets you a pretty little graph, like this:

Updated 2019-03-06: note that the Wunderground API appears to be really and truly dead.